Introduction
As an avid basketball fan, I often find myself plopped in front of a TV paying close attention to the details of the game. There are a lot of things that catch my eye, but one, in particular, is the box score (AKA the stat sheet). A major component of the stat sheet is a team’s shooting percentage, also known as field goal percentage. A team or player’s field goal percentage (FG %) can be measured by taking the number of shots made divided by the total number of shots. Again, this can be measured for a team or a specific player.
Generally, you would be inclined to think that the team with the higher FG% should win the game. And in most games, I would argue that is the case. However, other factors would play into the outcome of the game besides how well a team shoots from the field (i.e. free throws, turnovers, etc.) But I won’t bore you with those details right now…
What we do know is that FG % is a MAJOR factor. After all, the goal is to score more points than the other team, and FG % is a direct measure of scoring. And as I watch these NBA games, I become curious. Throughout a season, what factors, if any at all, significantly affect the shooting percentage of players?
- Would players competing on their home court shoot a higher percentage than those competing on the road?
- Does the type of shot alter the shooting percentage?
- Is there a particular month that players make shots at a higher rate?
Below I will investigate these questions and more. Stay with me, because I think you will find the results interesting!
Data
I worked with a dataset found here. The dataset contains every shot taken during the 2014-2015 NBA season, except for games played after March 4th, 2015.
Hypotheses
Given a set of 2 circumstances, I hypothesized if FG % was the same in both circumstances, and if not, which circumstance would yield a higher FG %
- Shot Type: 2-pointers vs. 3 pointers
- Hypothesis: FG % is NOT the same, and players make a higher percentage of their shots on 2-point attempts.
- My Reasoning: This one seemed to be the most straightforward. I thought that the closer players were to the basket, the better chance they had at making the shot.
- Location: Home vs. Away
- Hypothesis: FG % is NOT the same, and players make a higher percentage of their shots during home games.
- My Reasoning: I think players tend to feel more comfortable at home games. The majority of the crowd is rooting for them, they didn’t have to travel far for the game, and their routine isn’t messed up from traveling. I thought this would lead to better a better shooting percentage at home.
- Regulation vs. Overtime (OT)
- Hypothesis: FG % is NOT the same, and players make a higher percentage of their shots during regulation.
- My Reasoning: Players are more tired during OT periods because they have been playing awhile already. Their bodies wear down and shooting becomes harder.
- Shot Clock: Varying Times
- Hypothesis: FG % is NOT the same, and players make a higher percentage of their as the shot clock winds down.
- My Reasoning: This was tough for me. At first, I thought the earlier the better, but then I thought players would be rushing shots early on. I thought that once you execute a play and move the ball around, it would lead to more open or better shots.
- By Month
- Hypothesis: FG % is NOT the same, and players make the highest percentage of their shots in the first month of the season.
- My Reasoning: This is when players are the freshest. Their bodies haven’t worn down yet. Defenders don’t know how to best guard certain players.
Results/Visualizations (Hypotheses 1-4)
For those interested in seeing the statistical test (T-Test) I used to test my hypotheses, please visit my code notebook linked at the bottom of this post. Below you can see the results from the first four testings. I have explained my findings underneath the graphs.
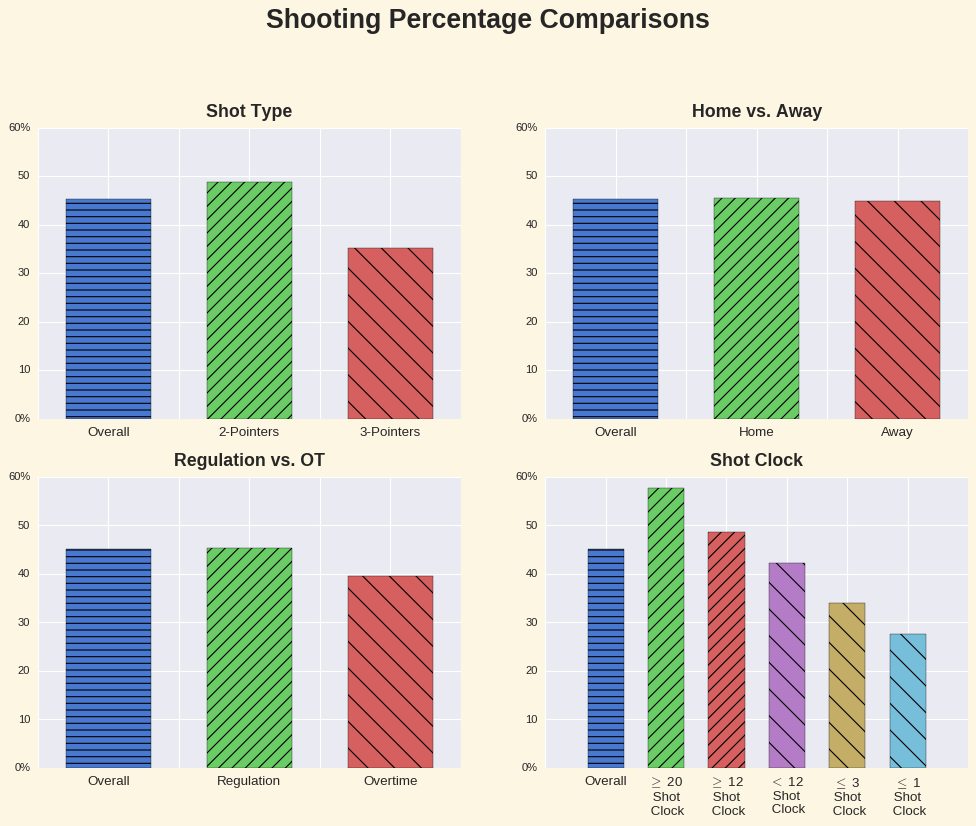
In each graph, I plotted an ‘overall’ field goal percentage. This is just the field goal percentage taking into account every observation (shot) in the dataset. Overall, players shot roughly 45.2% from the field for the 2014-15 season. We’ll call this the average FG % for the season.
In the top-left graph, we see that players shoot a higher percentage on 2-point shots.
- Hypothesis 1 was CORRECT
In the top-right graph, we see that players shoot a higher percentage when they are at home.
- Hypothesis 2 was CORRECT
In the bottom-left graph, we see that players shoot a higher percentage in regulation.
- Hypothesis 3 was CORRECT
In the bottom-right, we see that players shoot the highest percentage within the first 4 seconds of a possession, and then the shooting percentage gradually declines after that.
- Hypothesis 4 was INCORRECT
Results/Visualizations (Hypothesis 5)
The line graph below shows the progression of shooting percentage throughout the season.
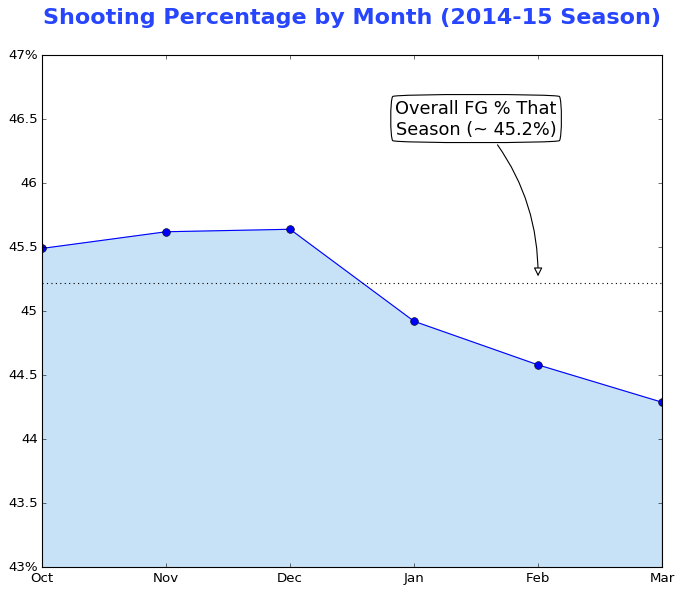
In the line graph above, I plotted the average FG % for each month during the 2014-15 NBA season. To clarify, this is the field goal percentage taking into account every shot during October, then every shot in November, and so on. You’ll see that for the first 3 months, there’s a gradual increase in shooting percentage, and then after December, the percentage begins to decline for the remainder of the season. To recall, my hypothesis for this testing:
FG % is NOT the same, and players make the highest percentage of their shots in the first month of the season.
- Thus, Hypothesis 5 was INCORRECT
Conclusion
Main Findings: There was a statistically significant difference in the shooting percentage of NBA players during the 2014-15 NBA season based on shot location (2-pointers vs. 3-pointers), game location (home vs. away), game time (regulation vs. overtime), and time on the shot clock.
What did we learn? We learned that shooting percentage tends to change based on circumstances. Here are a few takeaways or “nuggets” of information:
-
Players shot a higher percentage on 2-pointers than 3-pointers. This makes sense because 3-pointers are shot further away from the basket.
-
Players make their shots at a higher rate when playing on their home court, but the difference in rates between ‘home’ and ‘away’ may not be as large as you think.
-
Players make nearly 58% of their shots when shooting within the first 4 seconds of a possession, as opposed to making only about 28% of their shots in the last second of this possession. Logically this makes sense as the first 4 seconds could include a lot of offensive rebound tip-ins and layups because the shot clock resets after hitting the rim. Moreover, if a player is shooting a shot within the last second of the shot clock, chances are they are throwing up a wild shot or being very tightly contested by a defender.
-
Finally, the second half the NBA season saw a gradual decline in shooting percentage. You could potentially point to players wearing down physically as the season goes on, or defenders learning their counterparts’ offensive tendencies. And who knows, maybe the same can be inferred from the “Regulation vs. OT” graph.