A problem very much worth solving.
I recently got the amazing opportunity to work with a nonprofit organization called SaverLife. While partnering with SaverLife, our goal is to help people save their first $400. If you can believe it, 47 million adults nationwide don’t have $400 in their savings. SaverLife seeks to “make saving money easier and more rewarding” so that when you need to fix a flat tire, pay a speeding ticket, or cover some other emergency expense, you won’t have to take on debt.
There are just way too many adults who lack the savings to address the inevitable financial emergencies that come with life. The product we are currently building will allow these people to visualize their spending habits, and generate budgets that will get them on the road to saving money fast. I don’t know about you, but visualizing where I spend my money, as well as how much I spend, is super enlightening and eye-opening. It’s hard to change your spending habits if you don’t know what your current habits are. It’s hard to know where you should go if you don’t know where you’ve been.

One concern I had entering this project was with the data, specifically the anonymity of the data. I thought, if I were a user of this app, it could be really valuable to see how other people like me spend their money. Information such as residential location, income, age, and marital status are just a few examples that would help identify where a user is spending money compared to other humans like them.
Problem ➡️ Problem-Solving
Upon receiving the product roadmap from the stakeholder, our first step was to break down our goals into shippable tasks. A major component of our product was to visualize a user’s transactions. These visualizations would both showcase a person’s past spending and forecast possible future budgets. We worked to break down each one of these ideas into individual tasks. Utilizing Trello, a visual tool for organizing projects, we brainstormed and laid out assignments for what it would take to ship this particular feature.
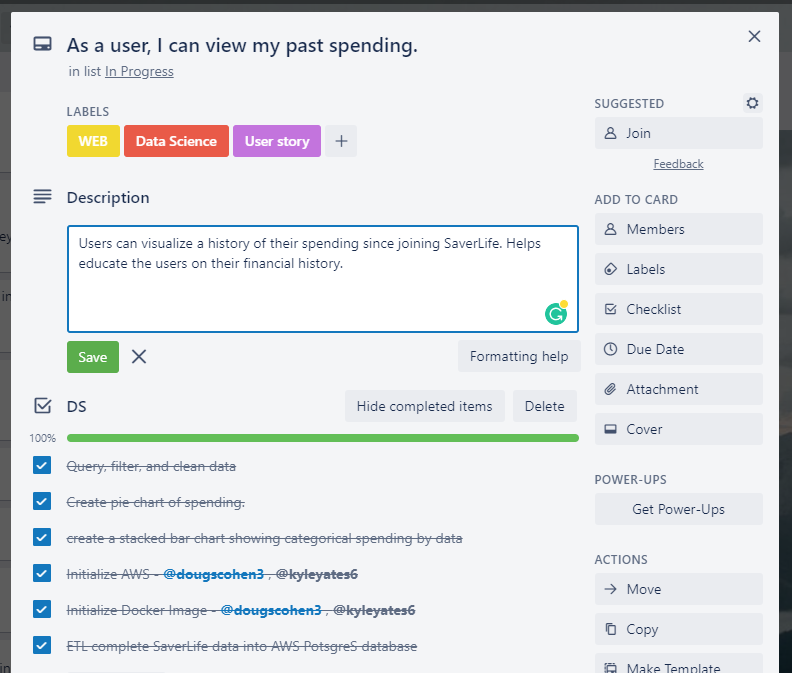
As a data scientist working on this product, you can see a few of the tasks I was responsible for in order to get this feature shipped, including exploratory data analysis, creating visuals with Plotly, and deploying our API to AWS Elastic Beanstalk.
Ok, you’ve made it this far. Let’s talk about implementation.
The first goal was to visualize a user’s past spending habits. This means over a certain time period (last week or month, for instance), users can see how much money they spent each day, and what they spent their money on, in terms of the category (ex. food, shopping, utilities, etc). In order to make this happen, we needed to:
- clean & filter the data
- query the data to and from an AWS PostgreSQL database
- create past spending visuals using Plotly
- setup Data Science API using FastAPI
- deploy API to AWS Elastic Beanstalk
Within this feature, I was primarily responsible for cleaning the data, while also setting up endpoints on our API for my web teammates to access. Using OOP (object-oriented programming) in Python, I created a User class that would be used to instantiate SaverLife users, and access the desired information about that user. I also contributed code for all 3 of our visuals, which I have talked about further down in this blog.
Additionally, we wanted to be able to recommend budgets for our users in order for them to get on the path to saving money. For instance, for user X, we recommend he spend $300 on food, $500 on shopping, and $75 on transportation over the course of a month. This takes the burden off people to do any sort of budgeting themselves. The goal is to make it as user-friendly as possible. For this particular feature, I just needed to add 2 additional endpoints, which our web team would access to render a budgeting visual.
Implementing these features did not come without its technical challenges, though. One technical challenge that the Data Science team faced was unfamiliarity with AWS, Docker, and FastAPI. Thus, there was a lot of troubleshooting with deploying our API initially. Because it was a matter of experience, we simply just needed to familiarize ourselves with the documentation and just spend the time getting familiar with those particular parts of our tech stack.
Another challenge our team faced, data scientists, in particular, was the lack of demographic information in the data. This affected our goals and intentions for the project. For example, we didn’t have access to every user’s income or any other demographic information such as age or family size. We had dreamed up an idea to have a budget comparison feature. For instance, how does a 37-year-old male living in San Francisco spend money in comparison to other 37-year-old San Francisco males? Knowing what we knew about our data, we overcame this by having the user manually input the necessary information that we needed, such as income. This workaround allowed us to complete some of the functionality we wanted to, but in fear of burdening the users for too much additional data, we decided to limit the amount of information that they would provide us.
The current state of the product & what’s in store 👀
As it stands currently, our product exists with several features:
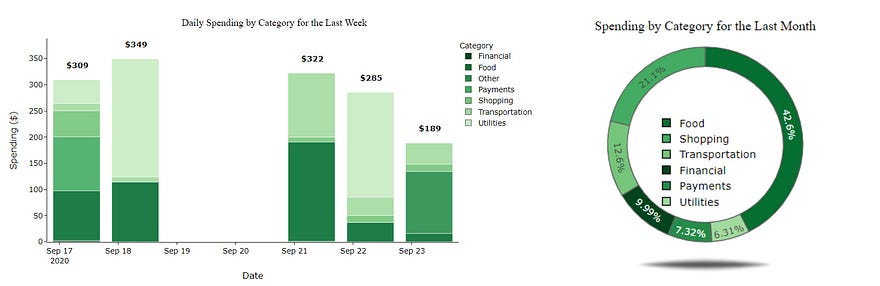
- Users are able to log in and see their past spending habits. There are 2 visualizations at their disposal, one being a pie graph(or donut graph, whichever you prefer to call it), breaking down your total spending by category over a given time period. The other being a bar graph, showcasing your daily spending by category over a given time period.
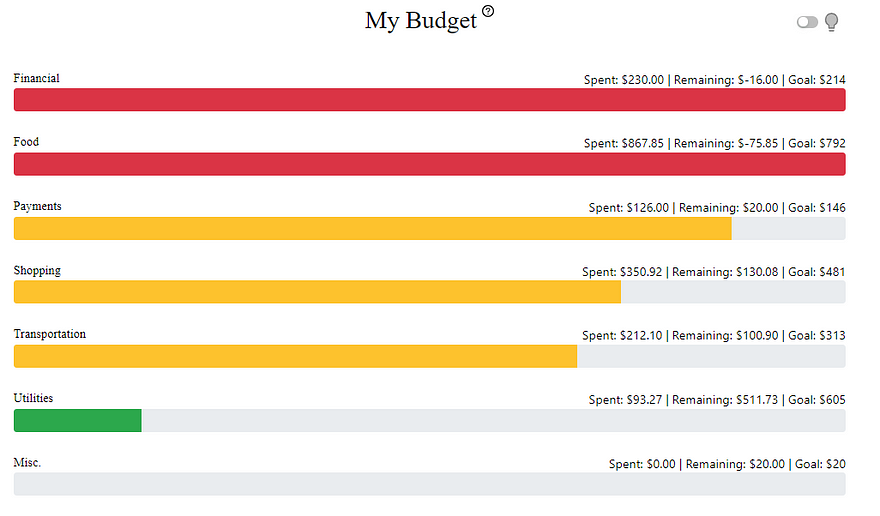
- Users have access to a budget recommendation feature. Essentially, users input the amount of money they would like to save monthly, and we recommend a budget for them to follow for the month. We used a time-series forecasting model known as exponential smoothing to predict how much a user would spend in the upcoming month for each spending category (shopping, food, utilities, etc.). After this, we use a budget modification algorithm in which we subtract the user’s savings goals from discretionary categories. The user’s budget is then visualized on the app, showing how their current month’s spending relates to their recommended goals.
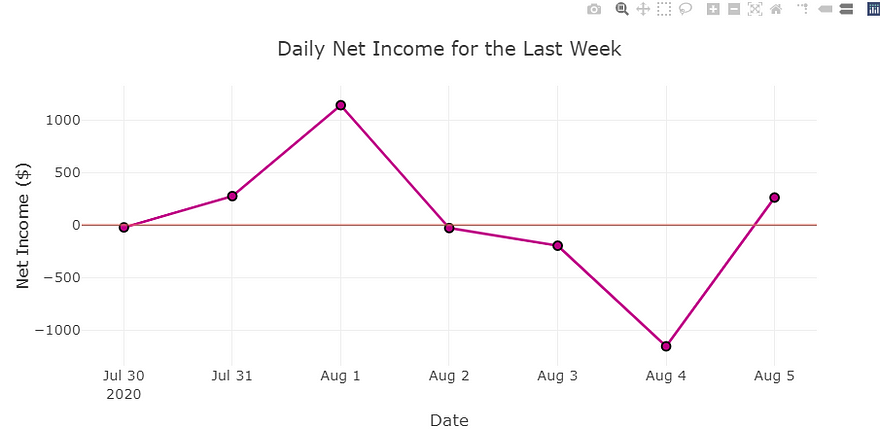
- Users can visualize daily net income over time. We showcase a day by day history of how money flows in and out of their wallets.
So what’s in store? Something we would like to implement in the future is some sort of machine learning to more accurately identify spending categories as more or less discretionary. Additionally, we would want to look into other statistic-based forecasting models such as ARIMA or Facebook’s Prophet library. Both of these ideas serve to make better budget recommendations to SaverLife users.
Also, I mentioned the data is anonymized, but depending on if we can get income information from a user (either from more data that SaverLife grants us or from having the user manually input that information) we can at least do a very surface level “budget comparison” feature focused on users with the same income levels. Other demographic information, such as location or employment status, would be great for this feature as well.
Let’s Recap 📝
Saving money is HARD. Keeping track of the money going in and out of your bank account can seem tedious and annoying. But my team partnered with SaverLife to make this idea of “budgeting” a little simpler. We believe the first step in saving money is financial awareness. Being conscious of your spending can go a long way, thus, we offer a product to visualize your past spending habits. We also recognize that budgeting is difficult, and you don’t always know where to start. My team is here to ease that burden and suggest a budget for you to follow, so all you have to do is not spend more than you are supposed to.
I had a blast working on this product, and although there were many challenges my team and I came across, the hope of helping thousands of adults become financially responsible is what kept us going!